Langfuse Callback Handler#
Langfuse is an open source LLM engineering platform to help teams collaboratively debug, analyze and iterate on their LLM Applications.
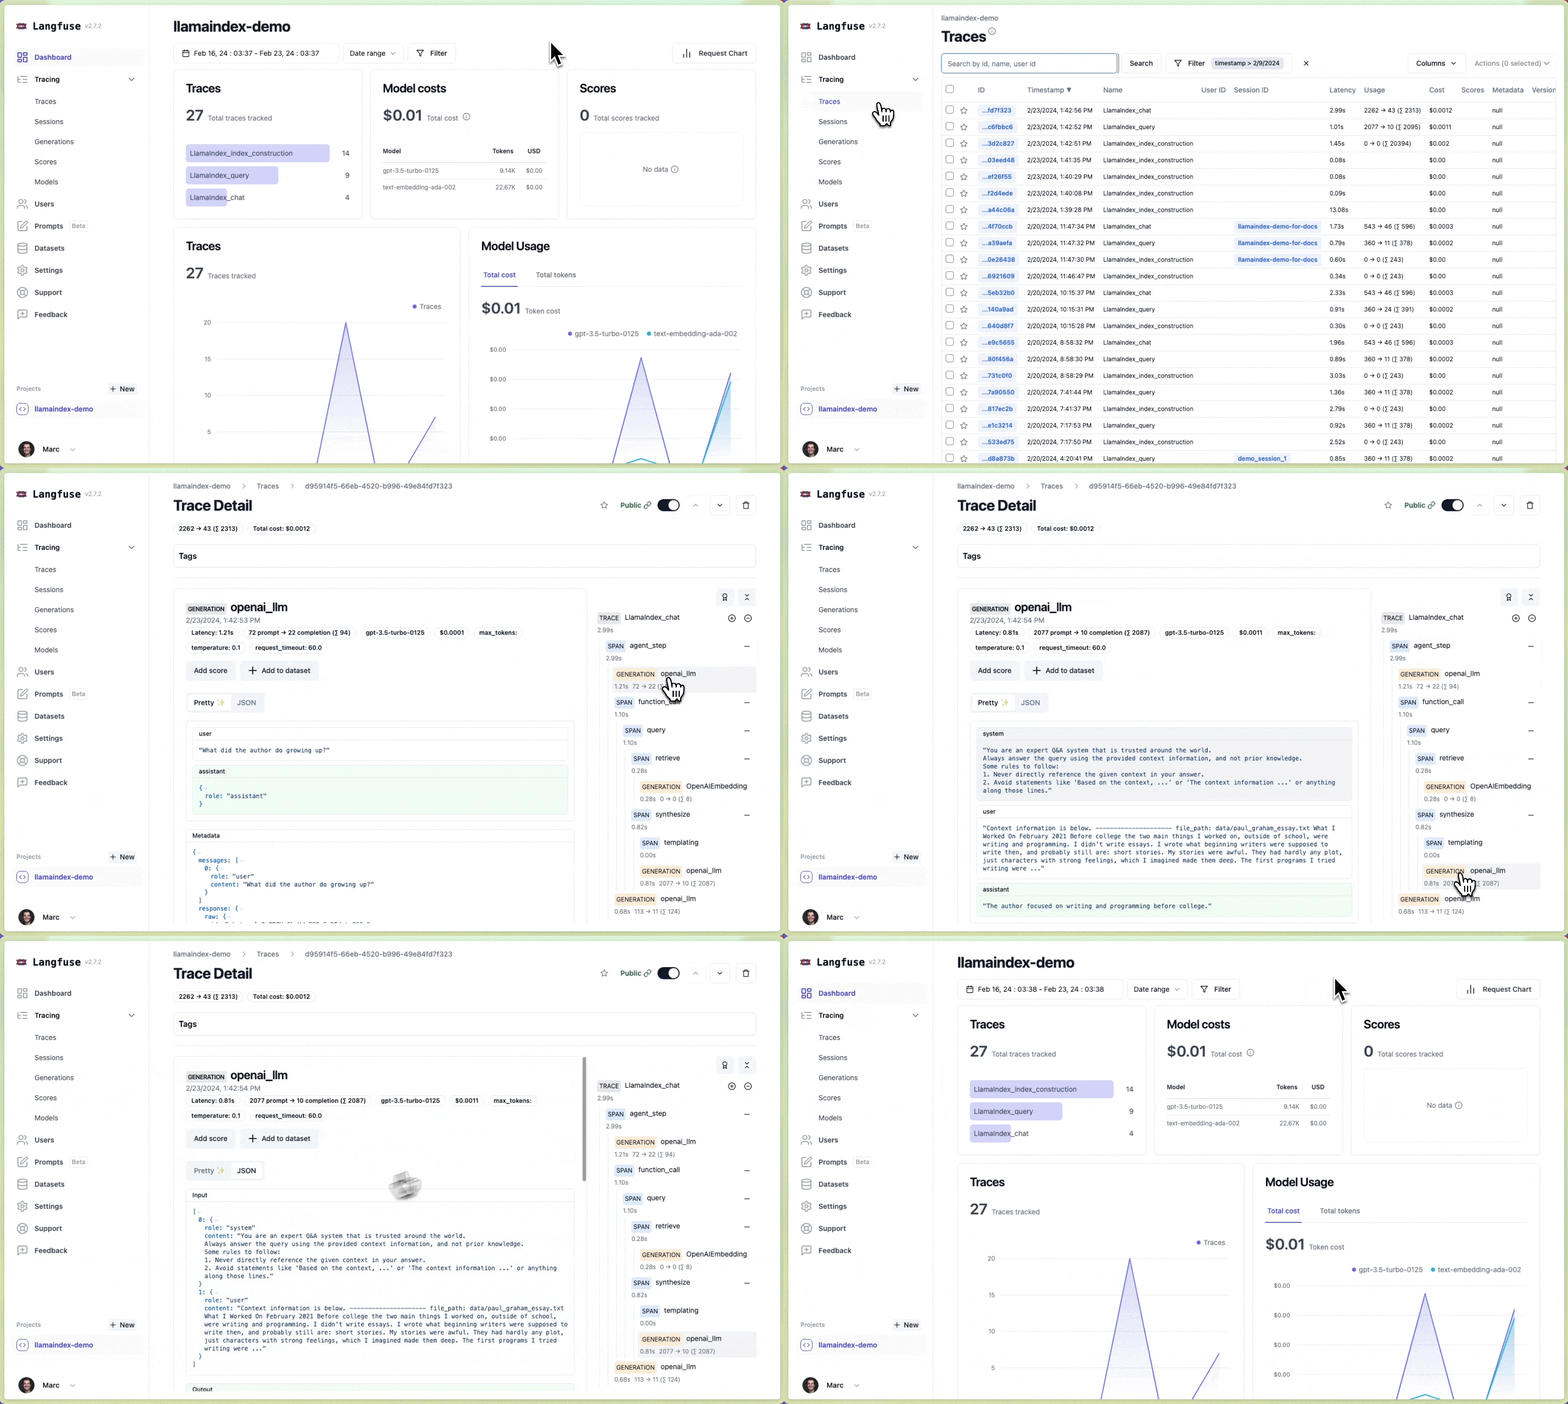
The LangfuseCallbackHandler is integrated with Langfuse and empowers you to seamlessly track and monitor performance, traces, and metrics of your LlamaIndex application. Detailed traces of the LlamaIndex context augmentation and the LLM querying processes are captured and can be inspected directly in the Langfuse UI.

Setup#
Install packages#
%pip install llama-index llama-index-callbacks-langfuse
Configure environment#
If you haven’t done yet, sign up on Langfuse and obtain your API keys from the project settings.
import os

# Langfuse
os.environ["LANGFUSE_SECRET_KEY"] = "sk-lf-..."
os.environ["LANGFUSE_PUBLIC_KEY"] = "pk-lf-..."
os.environ[
    "LANGFUSE_HOST"
] = "https://cloud.langfuse.com"  # 🇪🇺 EU region, 🇺🇸 US region: "https://us.cloud.langfuse.com"

# OpenAI
os.environ["OPENAI_API_KEY"] = "sk-..."
Register the Langfuse callback handler#
Option 1: Set global LlamaIndex handler#
from llama_index.core import global_handler, set_global_handler

set_global_handler("langfuse")
langfuse_callback_handler = global_handler
Option 2: Use Langfuse callback directly#
from llama_index.core import Settings
from llama_index.core.callbacks import CallbackManager
from langfuse.llama_index import LlamaIndexCallbackHandler

langfuse_callback_handler = LlamaIndexCallbackHandler()
Settings.callback_manager = CallbackManager([langfuse_callback_handler])
Flush events to Langfuse#
The Langfuse SDKs queue and batches events in the background to reduce the number of network requests and improve overall performance. Before exiting your application, make sure all queued events have been flushed to Langfuse servers.
# ... your LlamaIndex calls here ...

langfuse_callback_handler.flush()
Done!✨ Traces and metrics from your LlamaIndex application are now automatically tracked in Langfuse. If you construct a new index or query an LLM with your documents in context, your traces and metrics are immediately visible in the Langfuse UI. Next, let’s take a look at how traces will look in Langfuse.
Example#
Fetch and save example data.
!mkdir -p 'data/'
!wget 'https://raw.githubusercontent.com/run-llama/llama_index/main/docs/examples/data/paul_graham/paul_graham_essay.txt' -O 'data/paul_graham_essay.txt'
Run an example index construction, query, and chat.
from llama_index.core import SimpleDirectoryReader, VectorStoreIndex

# Create index
documents = SimpleDirectoryReader("data").load_data()
index = VectorStoreIndex.from_documents(documents)

# Execute query
query_engine = index.as_query_engine()
query_response = query_engine.query("What did the author do growing up?")
print(query_response)

# Execute chat query
chat_engine = index.as_chat_engine()
chat_response = chat_engine.chat("What did the author do growing up?")
print(chat_response)

# As we want to immediately see result in Langfuse, we need to flush the callback handler
langfuse_callback_handler.flush()
Done!✨ You will now see traces of your index and query in your Langfuse project.
Example traces (public links):
📚 More details#
Check out the full Langfuse documentation for more details on Langfuse’s tracing and analytics capabilities and how to make most of this integration.